Introduction
In this project, the goal was to create an integral solution for the management and visualization of geospatial data. For this, it was necessary to develop a viewer capable of monitoring the position of livestock in relation to the boundaries of different farms, allowing for the dynamic filtering and visualization of data.
System Architecture
The system is divided into three fundamental layers that ensure an efficient data flow:
1. Preprocessing (Data Engineering)
We use a Jupyter Notebooks environment (preprocess.ipynb) to clean and transform raw data (cows_pos.csv and fincas.json). Here we normalize coordinates, perform spatial joins, and prepare the dataset for consumption.
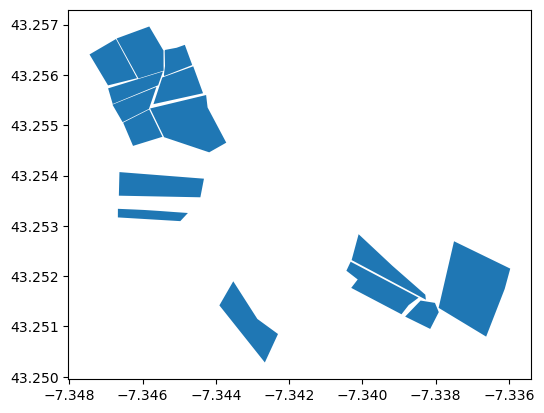
Farm data used in the spatial join
2. Backend (Server and Queries)
We created two backend modalities to serve information to the map:
- GeoServer: For industry-standard layer management (OGC).
- Custom API (Python + FastAPI): A custom development using
uvicornthat allows us greater flexibility, including point clustering management to improve the user experience when data volume is high.
3. Frontend (Interactive Viewer)
The viewer was built using Leaflet.js, allowing:
- Dynamic switching between base maps (Satellite / Fontán).
- Layer control (Cows inside/outside farms, 15-meter buffers).
- Interaction with the server for loading geometries and points in real-time.
Results
The final result is a functional tool that allows users to:
- Visualize the location of livestock on real maps.
- Identify anomalies (cows outside the farms).
- Switch between different data sources (GeoServer vs. custom server) using a simple script change on the client side.
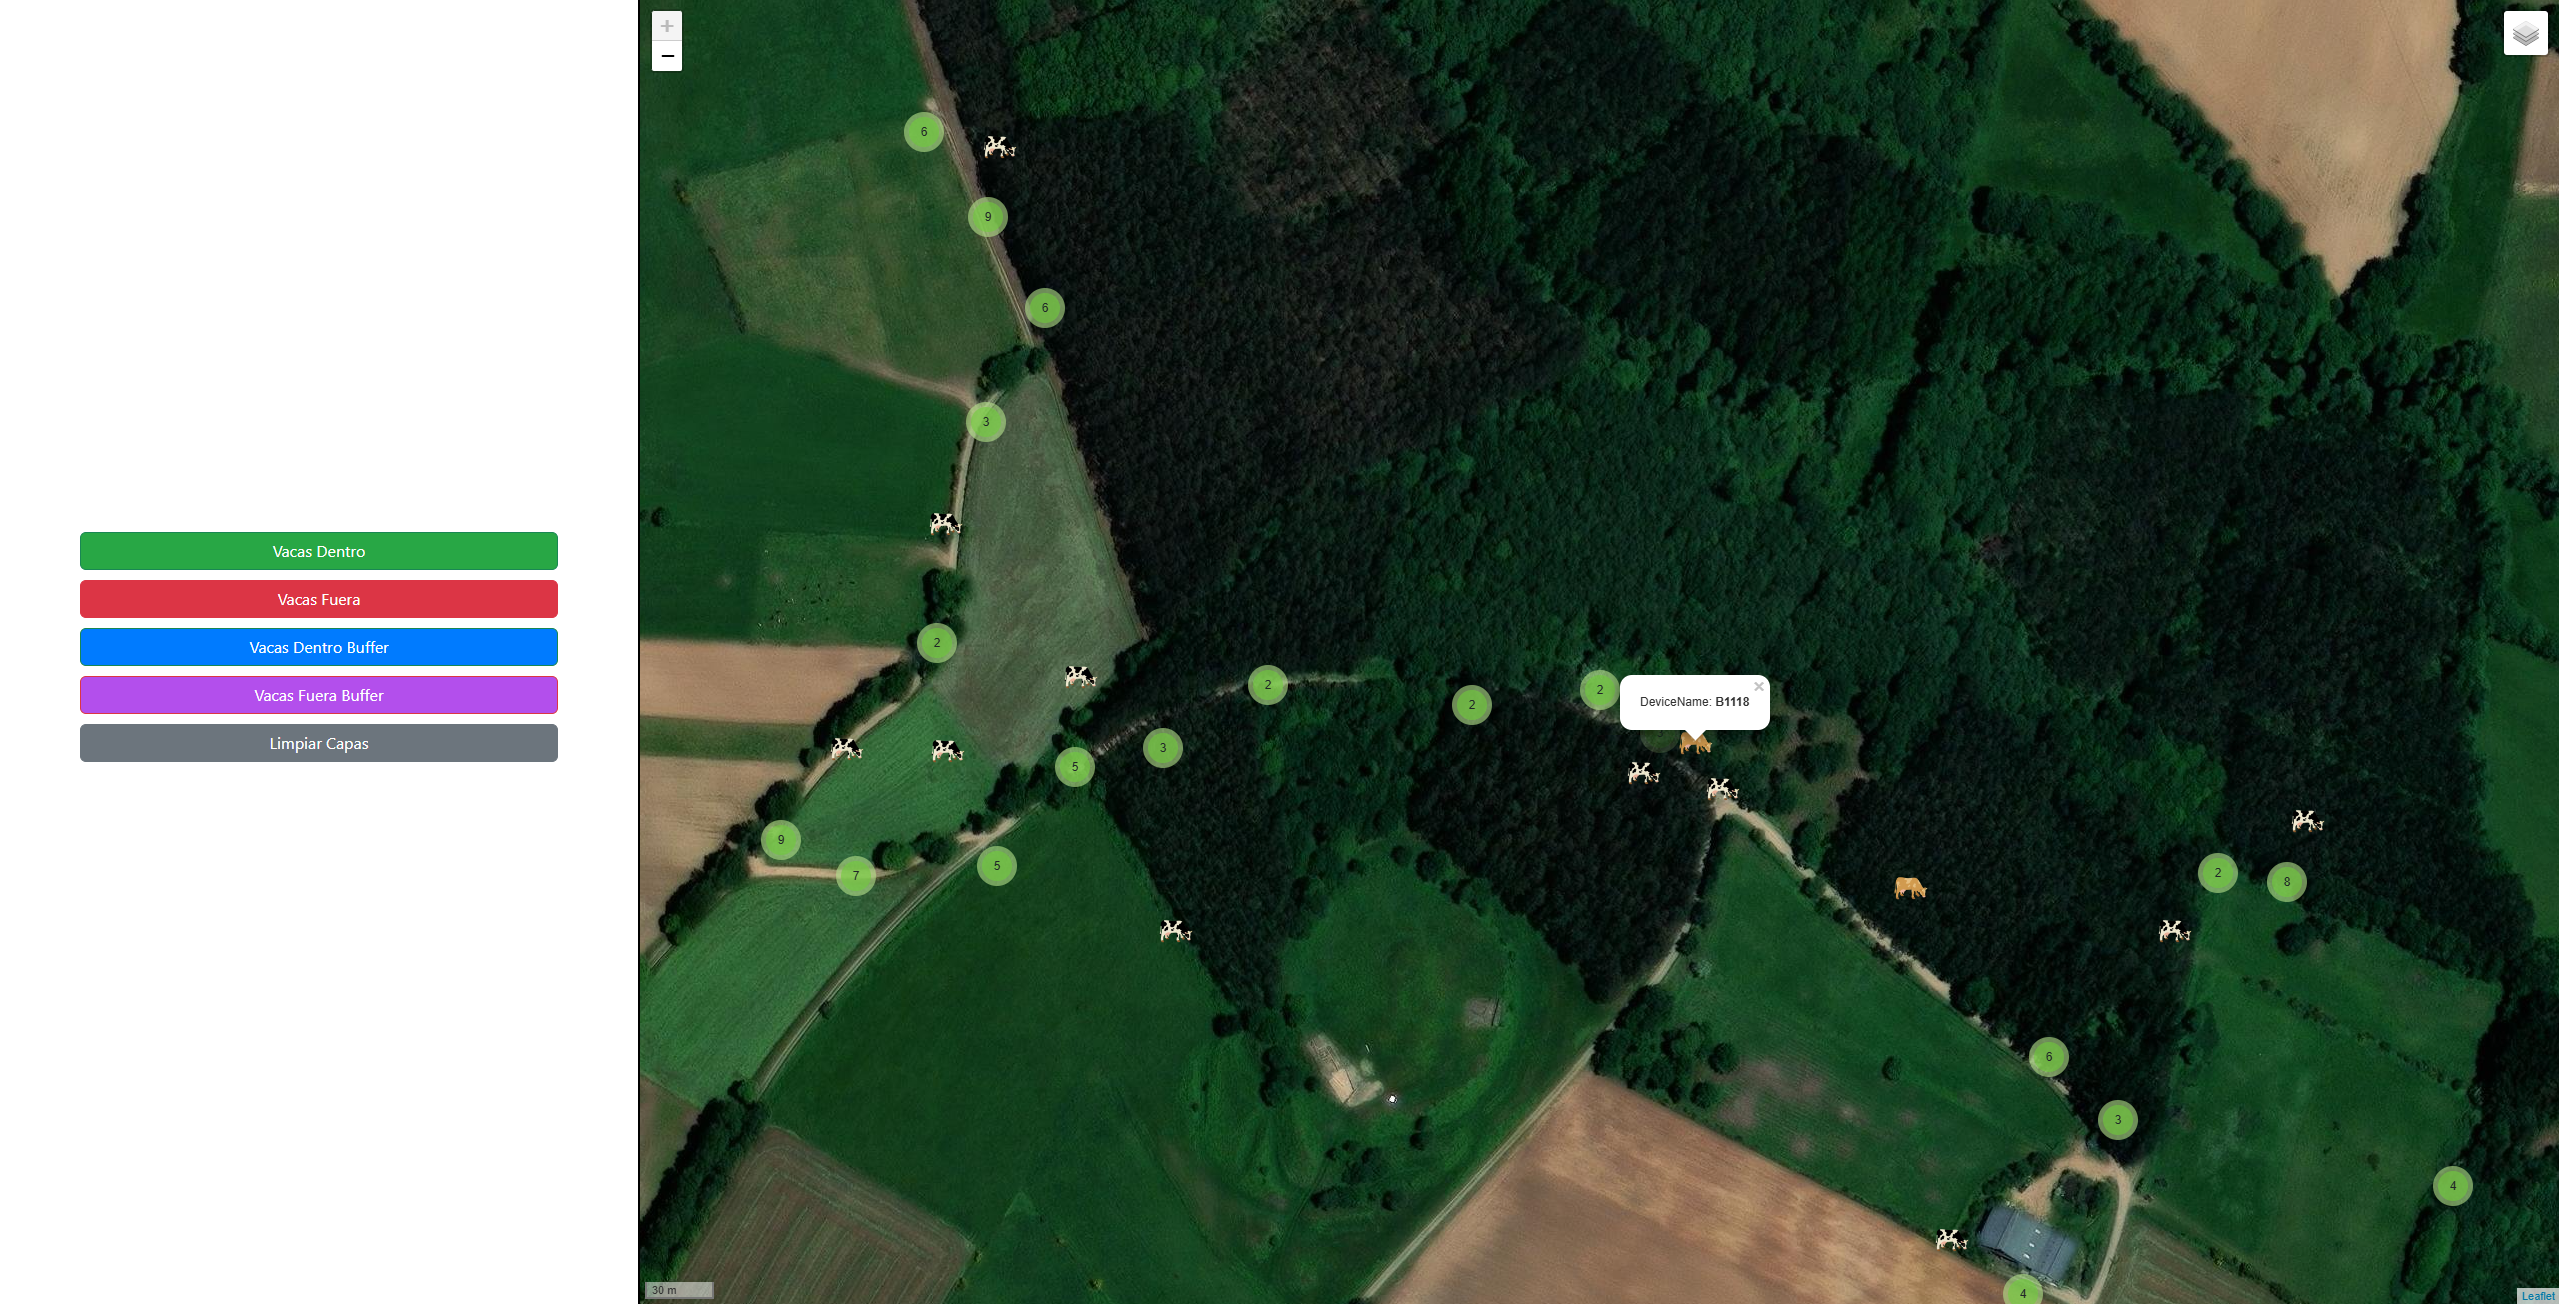
Viewer with custom server
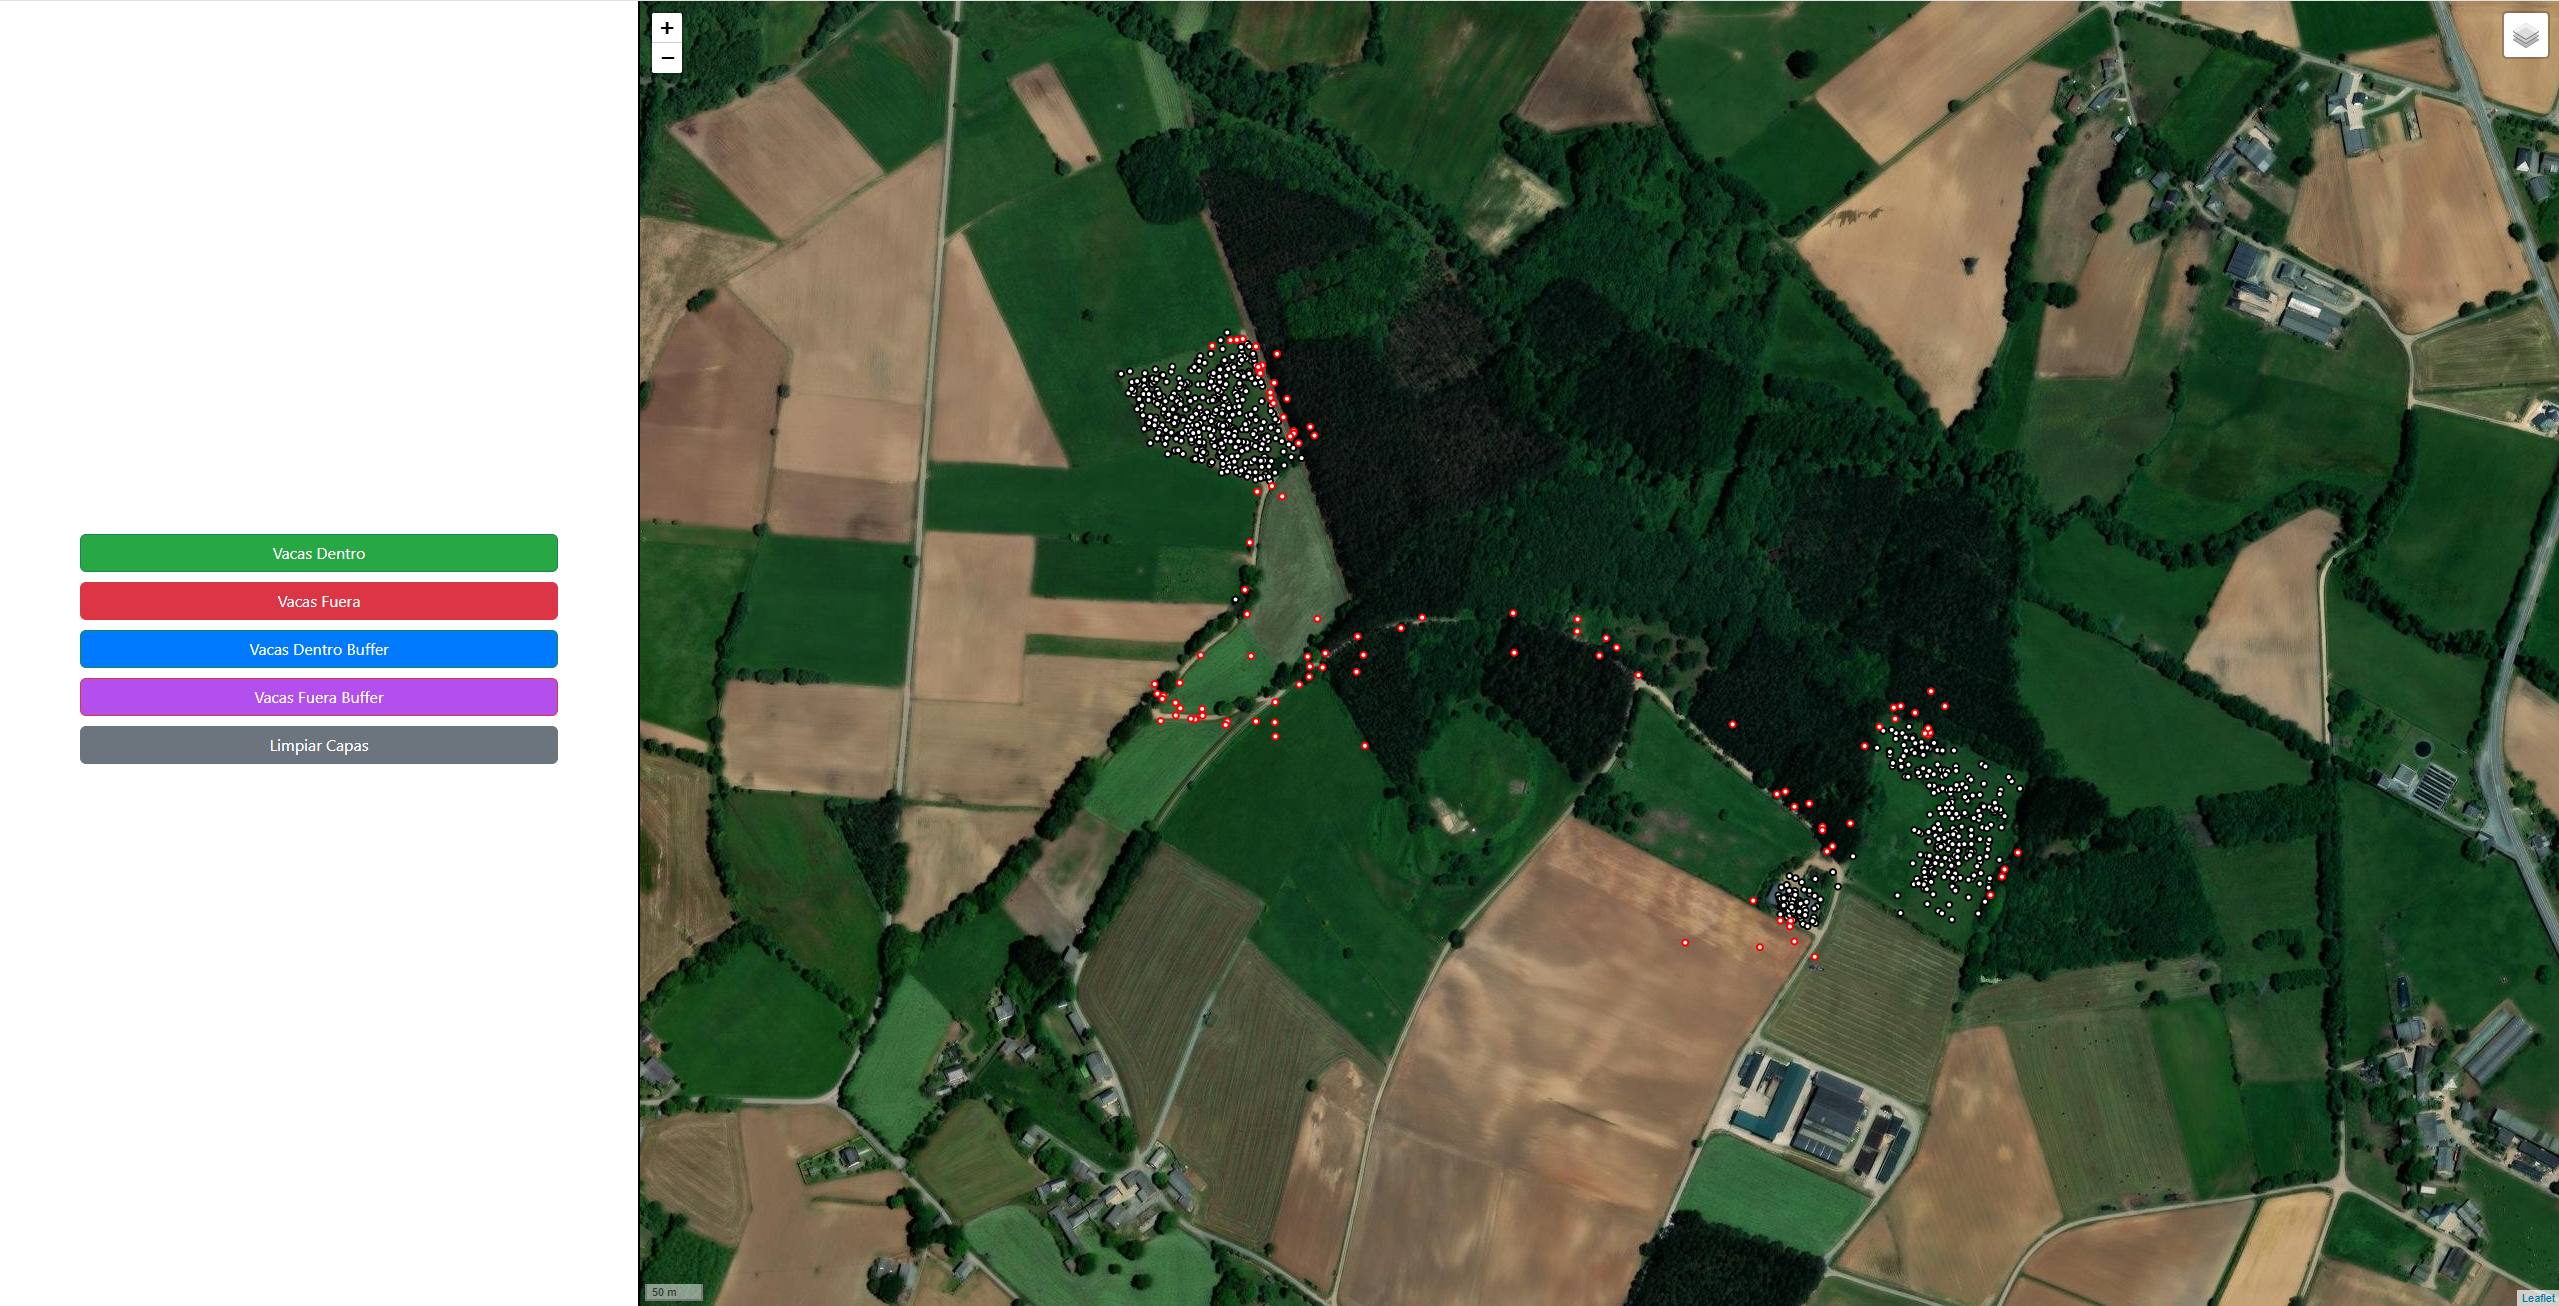
Viewer with GeoServer
More Information
For more details on the implementation, the source code, and the data used, you can visit the project repository on GitHub: Geospatial Viewer for cattle management